Ogden Valley Area Real Estate Statistics for December Showed a Growing Awareness by Sellers of the Continuation of a Weak Market.
December 2025 real estate statistics for the Ogden Valley, Mountain Green and Ogden Bench showed little change in median price or median price per sq. ft. for properties sold. What did change was the removal of a significant number of properties from the market as sellers became frustrated with the weakness in the market. Fewer properties sold in December than in November.
Single family homes on the market in the Ogden Valley dropped from 68 in November to 57 in December, and condos and townhomes from 37 to 33. In Mountain Green properties for sale decreased from 36 to 19, along the Ogden Bench from 102 to 71, and in North Ogden from 127 to 84.
For more information on properties or to search for Ogden Valley and surrounding area properties, visit:
www.ogdenvalleyrealestateguide.com
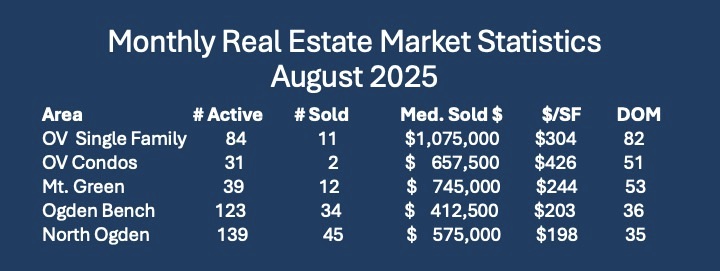
Monthly Real Estate Market Statistics – December 2025
Ogden Valley single family; Ogden Valley condos/townhomes; Mt. Green single family/condos/townhomes; Ogden Bench single family/condos/townhomes; North Ogden single family/condos/townhomes