Santa Fe Real Estate Activity Picks Up Dramatically in July
The July residential real estate sales statistics for key areas in Santa Fe showed a dramatic increase in activity across the board as well as substantial price increases in three of the eight areas featured.
All areas had increases in new inventory coming on the market. Las Campanas and the North and South NW Quadrants saw significant increases in average price of properties sold and price per sq. ft., with Las Campanas leading the way with a jump of $600,000 in average sales price and $100.00 in price per sq. ft. Five of the eight areas also recorded a drop in average days on the market.
July 2024 Real Estate Statistics for Key Areas in Santa Fe, New Mexico,
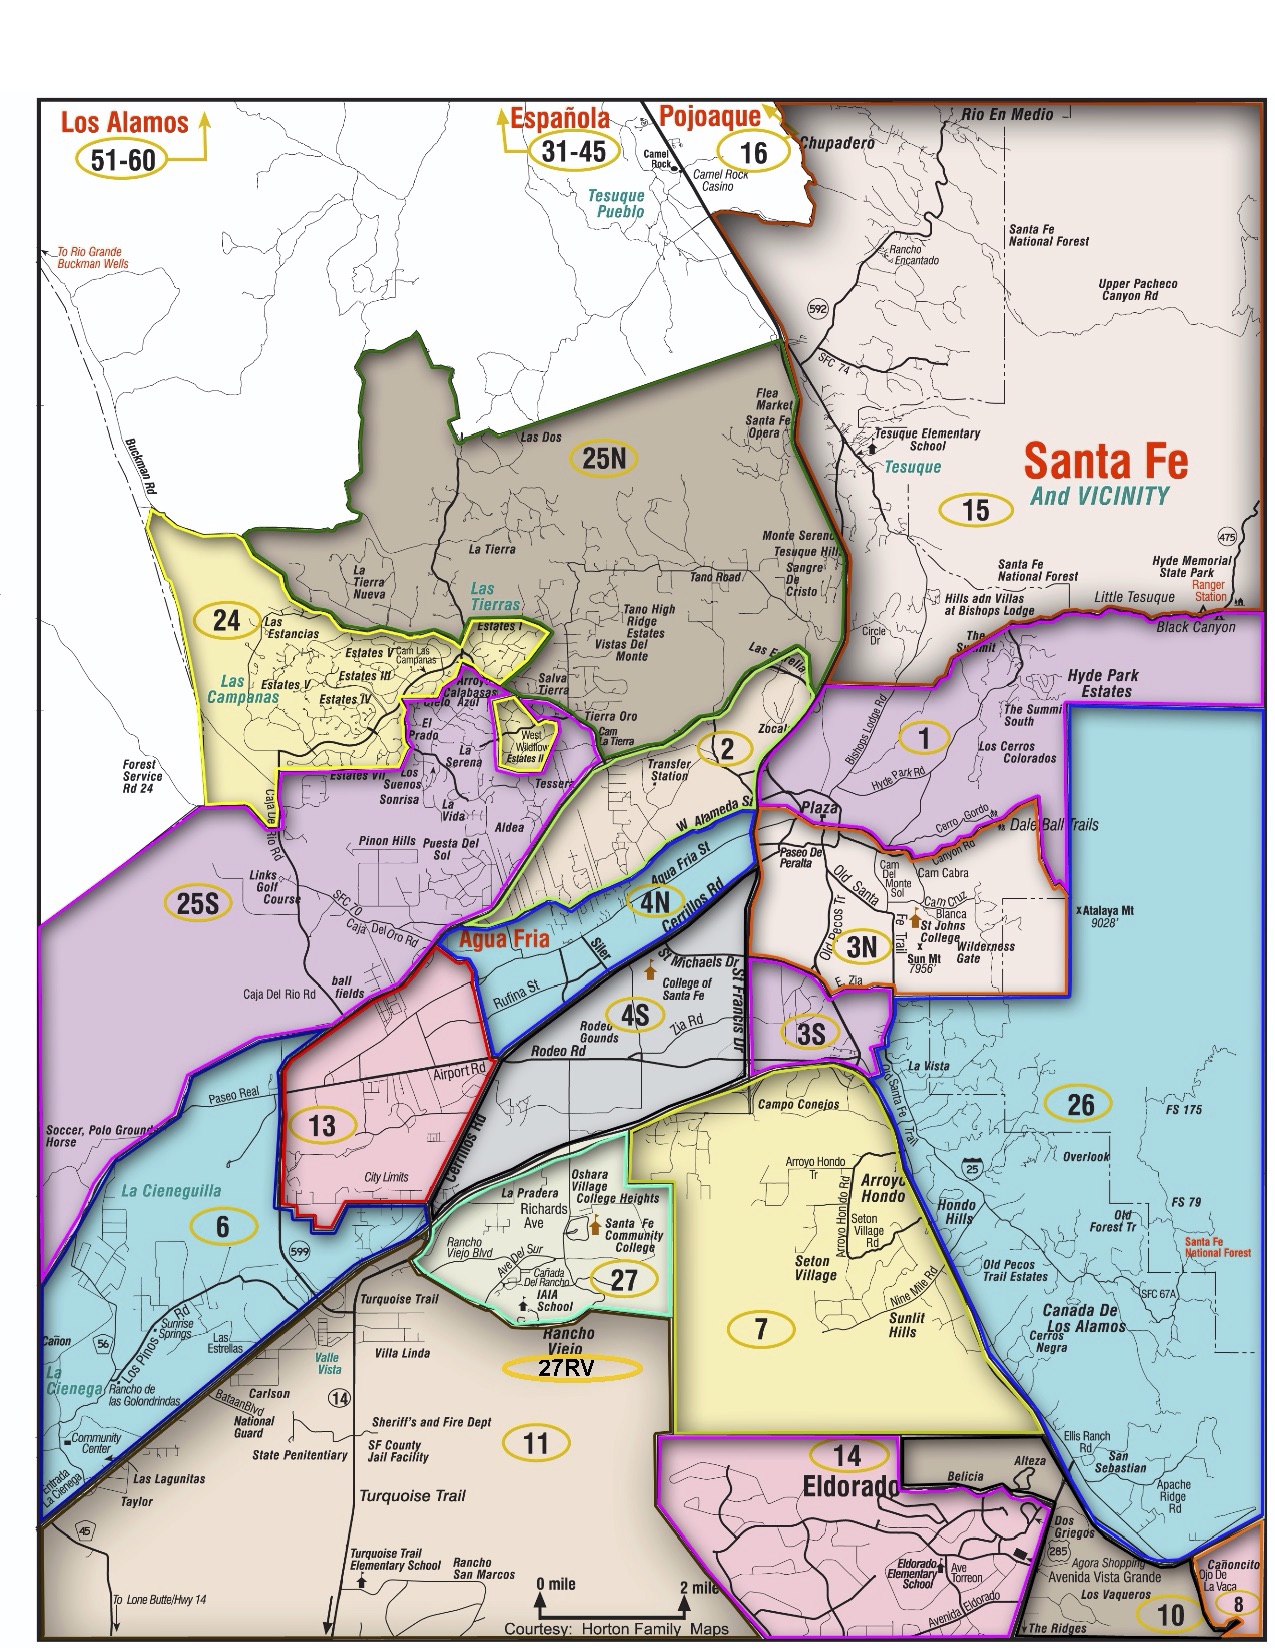
1-SF City Limits; 3N-SF City SE North; 4N-SF City Limit SWN; 14-El Dorado; 24-Las Campanas; 25N-NW Quadrant-N; 25S-NW Quadrant-S; 27RV-Rancho Viejo. ~SEE MAP BELOW STATISTICS~
AREA ACTIVE SOLD AVG. DAYS on MKT. AVG. PRICE AVG. $/SF
1 105 12 130 $ 1,424000 $479.00
3N 80 16 26 $1,329,000 $600.00
4N 41 17 39 $ 558,000 $344.00
14 29 13 7 $ 737,000 $349.00
24 52 4 33 $2,454,000 $629.00
25N-NW 25 1 3 $1,885,000 $554.00
25S-NW 20 6 31 $ 1,013,000 $427.00
27RV 19 6 16 $ 566,000 $357.00