Days on Market/Sales Cycle Shortens in May
The May residential sales statistics for key areas in Santa Fe showed some signs of upward movement in average sales price and price per sq. ft., but the most consistent sign of a strengthening market was a drop in days-on-the-market.
The Santa Fe area with the most dramatic uptick across the range of statistics was 3N, which had a drop in average days on the market from 100 in April to 31 in May. The average sales price in 3N increased from $1,032,000 to $1,400,000, while the price per sq. ft. climbed to $638.00 from $528.00.
May 2024 Real Estate Statistics for the Santa Fe, New Mexico, Area
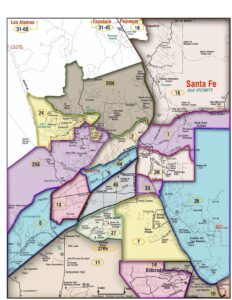
1-SF City Limits; 3N-SF City SE North; 4N-SF City Limit SWN; 14-El Dorado; 24-Las Campanas; 25N-NW Quadrant-N; 25S-NW Quadrant-S; 27RV-Rancho Viejo. ~SEE MAP BELOW STATISTICS~
AREA ACTIVE SOLD AVG. DAYS on MKT. AVG. PRICE AVG. $/SF
1 88 26 57 $1,221,000 $525.00
3N 53 13 31 $1,400,000 $638.00
4N 30 10 17 $543,000 $398.00
14 6 8 9 $676,000 $375.00
24 48 2 37 $2,175,000 $639.00
25N-NW 20 7 19 $1,371,000 $484.00
25S-NW 7 5 26 $1,145,000 $464.00
27RV 9 6 8 $709,000 $354.00