Inaugural Post – Santa Fe Area Monthly Real Estate Sales Statistics
May, 2024 marks the inaugural, monthly blog entry for my Santa Fe Real Estate Market Statistics Update. At the beginning of each month I will update the sales statistics from the previous month (April in this case) for a selection of Santa Fe MLS areas. By accessing previous month’s Statistics on the toolbar on the right, comparisons from previous months/possible trends, etc., can be detected. I will also comment each month on significant changes or emerging trends.
April 2024 Real Estate Statistics for the Santa Fe, New Mexico, Area
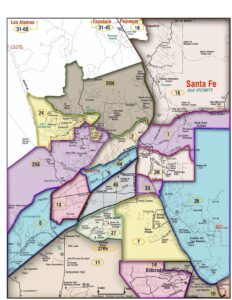
1-SF City Limits; 3N-SF City SE North; 4N-SF City Limit SWN; 14-El Dorado; 24-Las Campanas; 25N-NW Quadrant-N; 25S-NW Quadrant-S; 27RV-Rancho Viejo. ~SEE MAP BELOW STATISTICS~
AREA ACTIVE SOLD AVG. DAYS on MKT. AVG. PRICE AVG. $/SF
1 79 14 60 $1,190,000 $615.00
3N 42 17 100 $1,032,000 $528.00
4N 20 13 9 $635,000 $444.00
14 8 10 33 $698,000 $372.00
24 39 5 140 $2,164,000 $602.00
25N-NW 18 4 44 $1,204,000 $480.00
25S-NW 10 5 105 $1,145,000 $410.00
27RV 8 6 8 $674.00 $336.00

